Exploring a connectivity matrix for the selected brain parcellation
Via the https://github.com/FZJ-INM1-BDA/HBP-connectivity-component, the interactive atlas viewer allows interactive exploration of a connectivity matrix, that is defined for the currently selected brain parcellation and available from the HBP Knowledge Graph. As of now, this function is only available for the `JuBrain Cytoarchitectonic Atlas.
Launching the connectivity browser
-
Select the
JuBrain Cytoarchitectonic Atlasfrom the list of parcellations (available for theMNI Colin 27andICBM 2009c Nonlinear Asymmetrictemplates), and click on any brain region to bring up its context menu.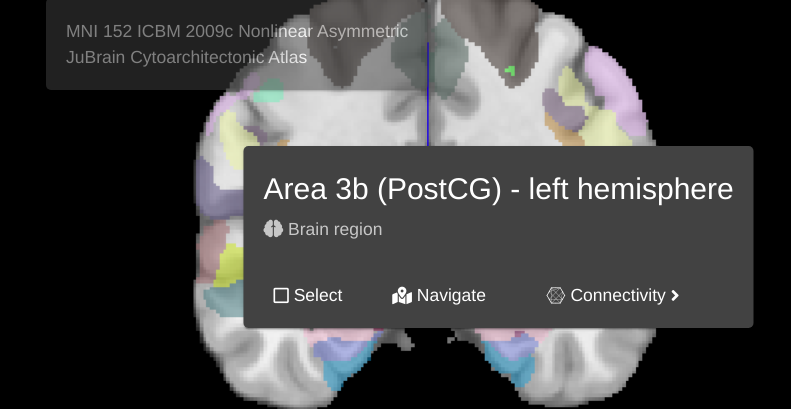
-
Select
Connectivityto select one of the available connecitivty matrices. Note that this list will be growing in the near future, to inlude connectivity information from different sources.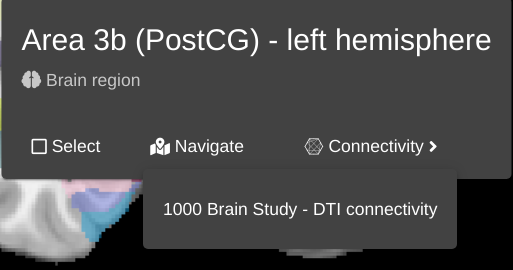
- This will load the connectivity browser with the source region for connection strengths set to the initially selected brain region.
Working with connectivity data
Upon selecting a preview dataset, several aspects of the UI will change:
-
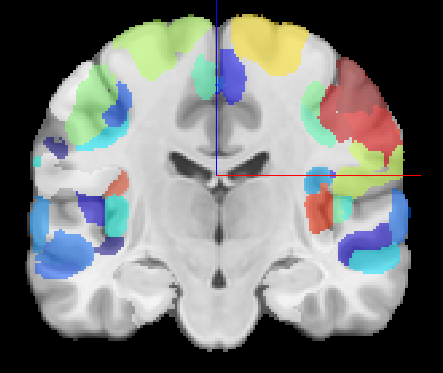
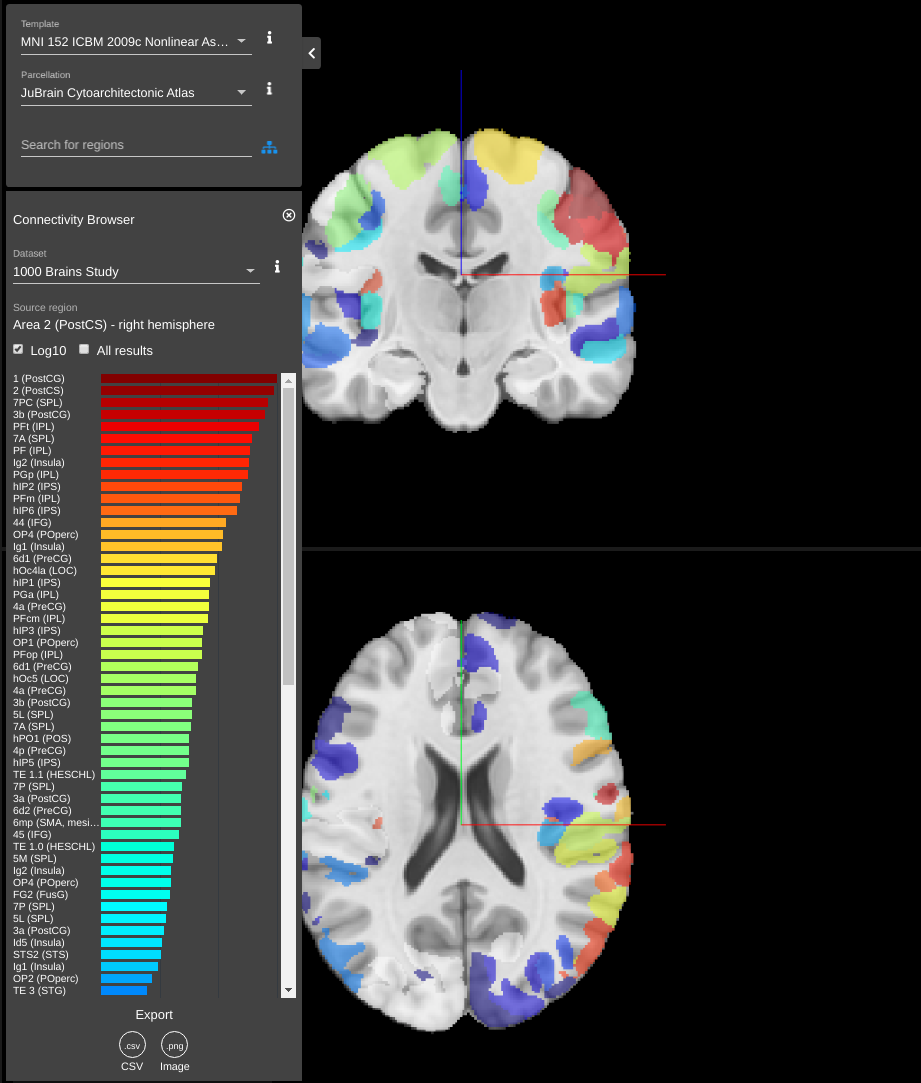
the color map of the parcellation will be replaced by a heat map of the connection strengths to the source region, effectively visualizing the corresponding row of the connectivity matrix:
Regular color map Connectivity heat map 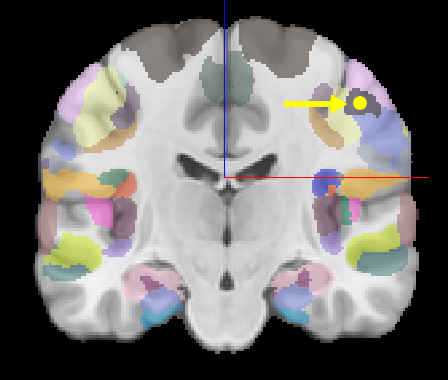
-
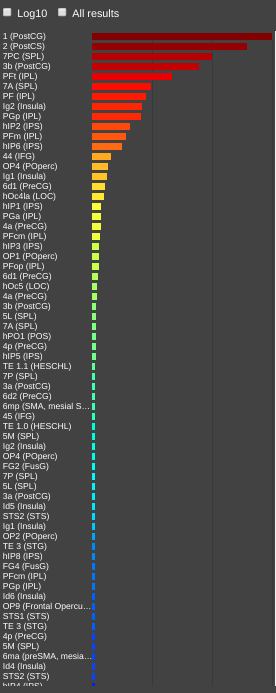
a side panel will be opened, showing the same connections strenghts as a horizontal bar plot. The source reion
Interactive exploration of connectivity using the tabulated view
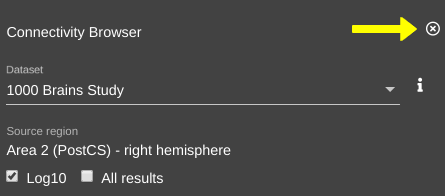
In the side panel, the selected connectivity matrix can be changed if applicable.

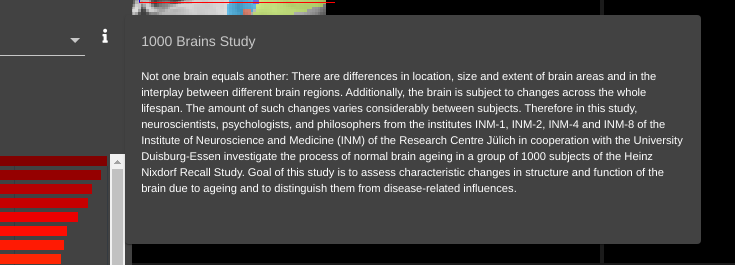
It also provides information about the selected source region.
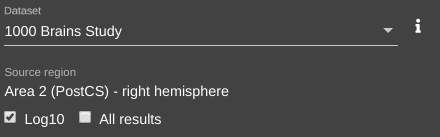
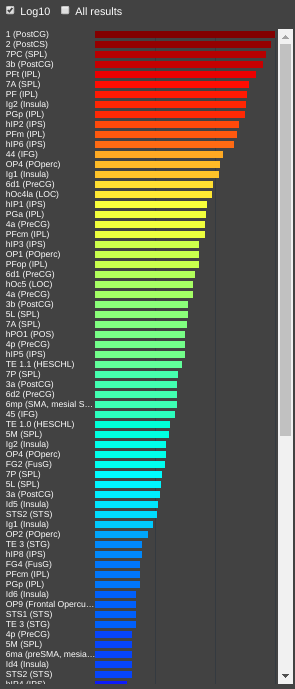
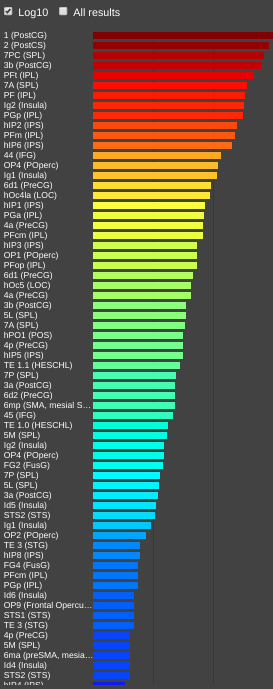
Display of connection strengths can be set to logarithmic scale using the Log10 checkbox:
Connectivity plotted logarithmically default |
Connectivity plotted linearly |
|---|---|
 |
 |
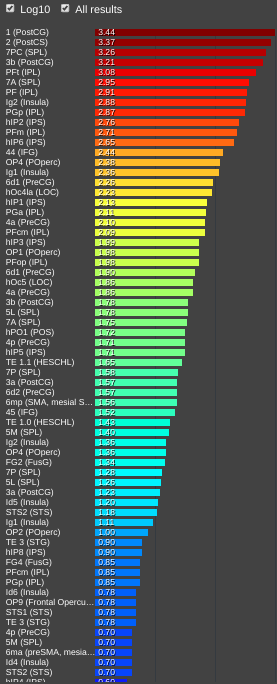
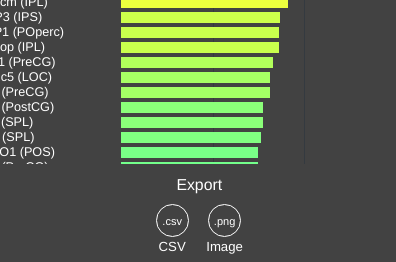
Selecting the All results checkbox will make the bar plot display the floating point numbers for each connection strength:
Hiding magnitude default |
Showing magnitude |
|---|---|
 |
 |
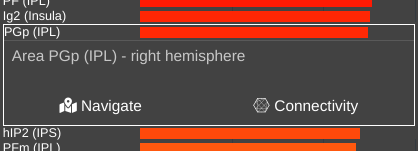
By clicking any of the bars, a context menu of the corersponding brain region will be brought up, providing information about the region and allowing to center the 3D view at this region, or select it as the new source region. The latter effectively selects a new row from the connectivity matrix.
Navigate- navigate to the region of interest.Connectivity- to the region of interest as the source, and explore its connectivity with other parcellation regions.
Export
Using the export buttons, the connectivity matrix can be exported as a CSV or PNG file.
Closing the connectivity browser
To exit the connectivity mode, click the close button located at the top right side of the side panel.
This will restore the colour map of the parcellation and close the side panel.